#NOE SCL
NOE SCL is an interactive project that shows different types of data of the city of Santiago, Chile, and analyzed that data using a series of algorithms. As part of the team that worked on this project, I was in charge of developing all the visualizations and data analysis.
The project consisted in three visualizations of data in the city: transport, contamination and consumption. There was a fourth visualization that shows a combined analysis of the other 3, with heatmaps and other specific data.
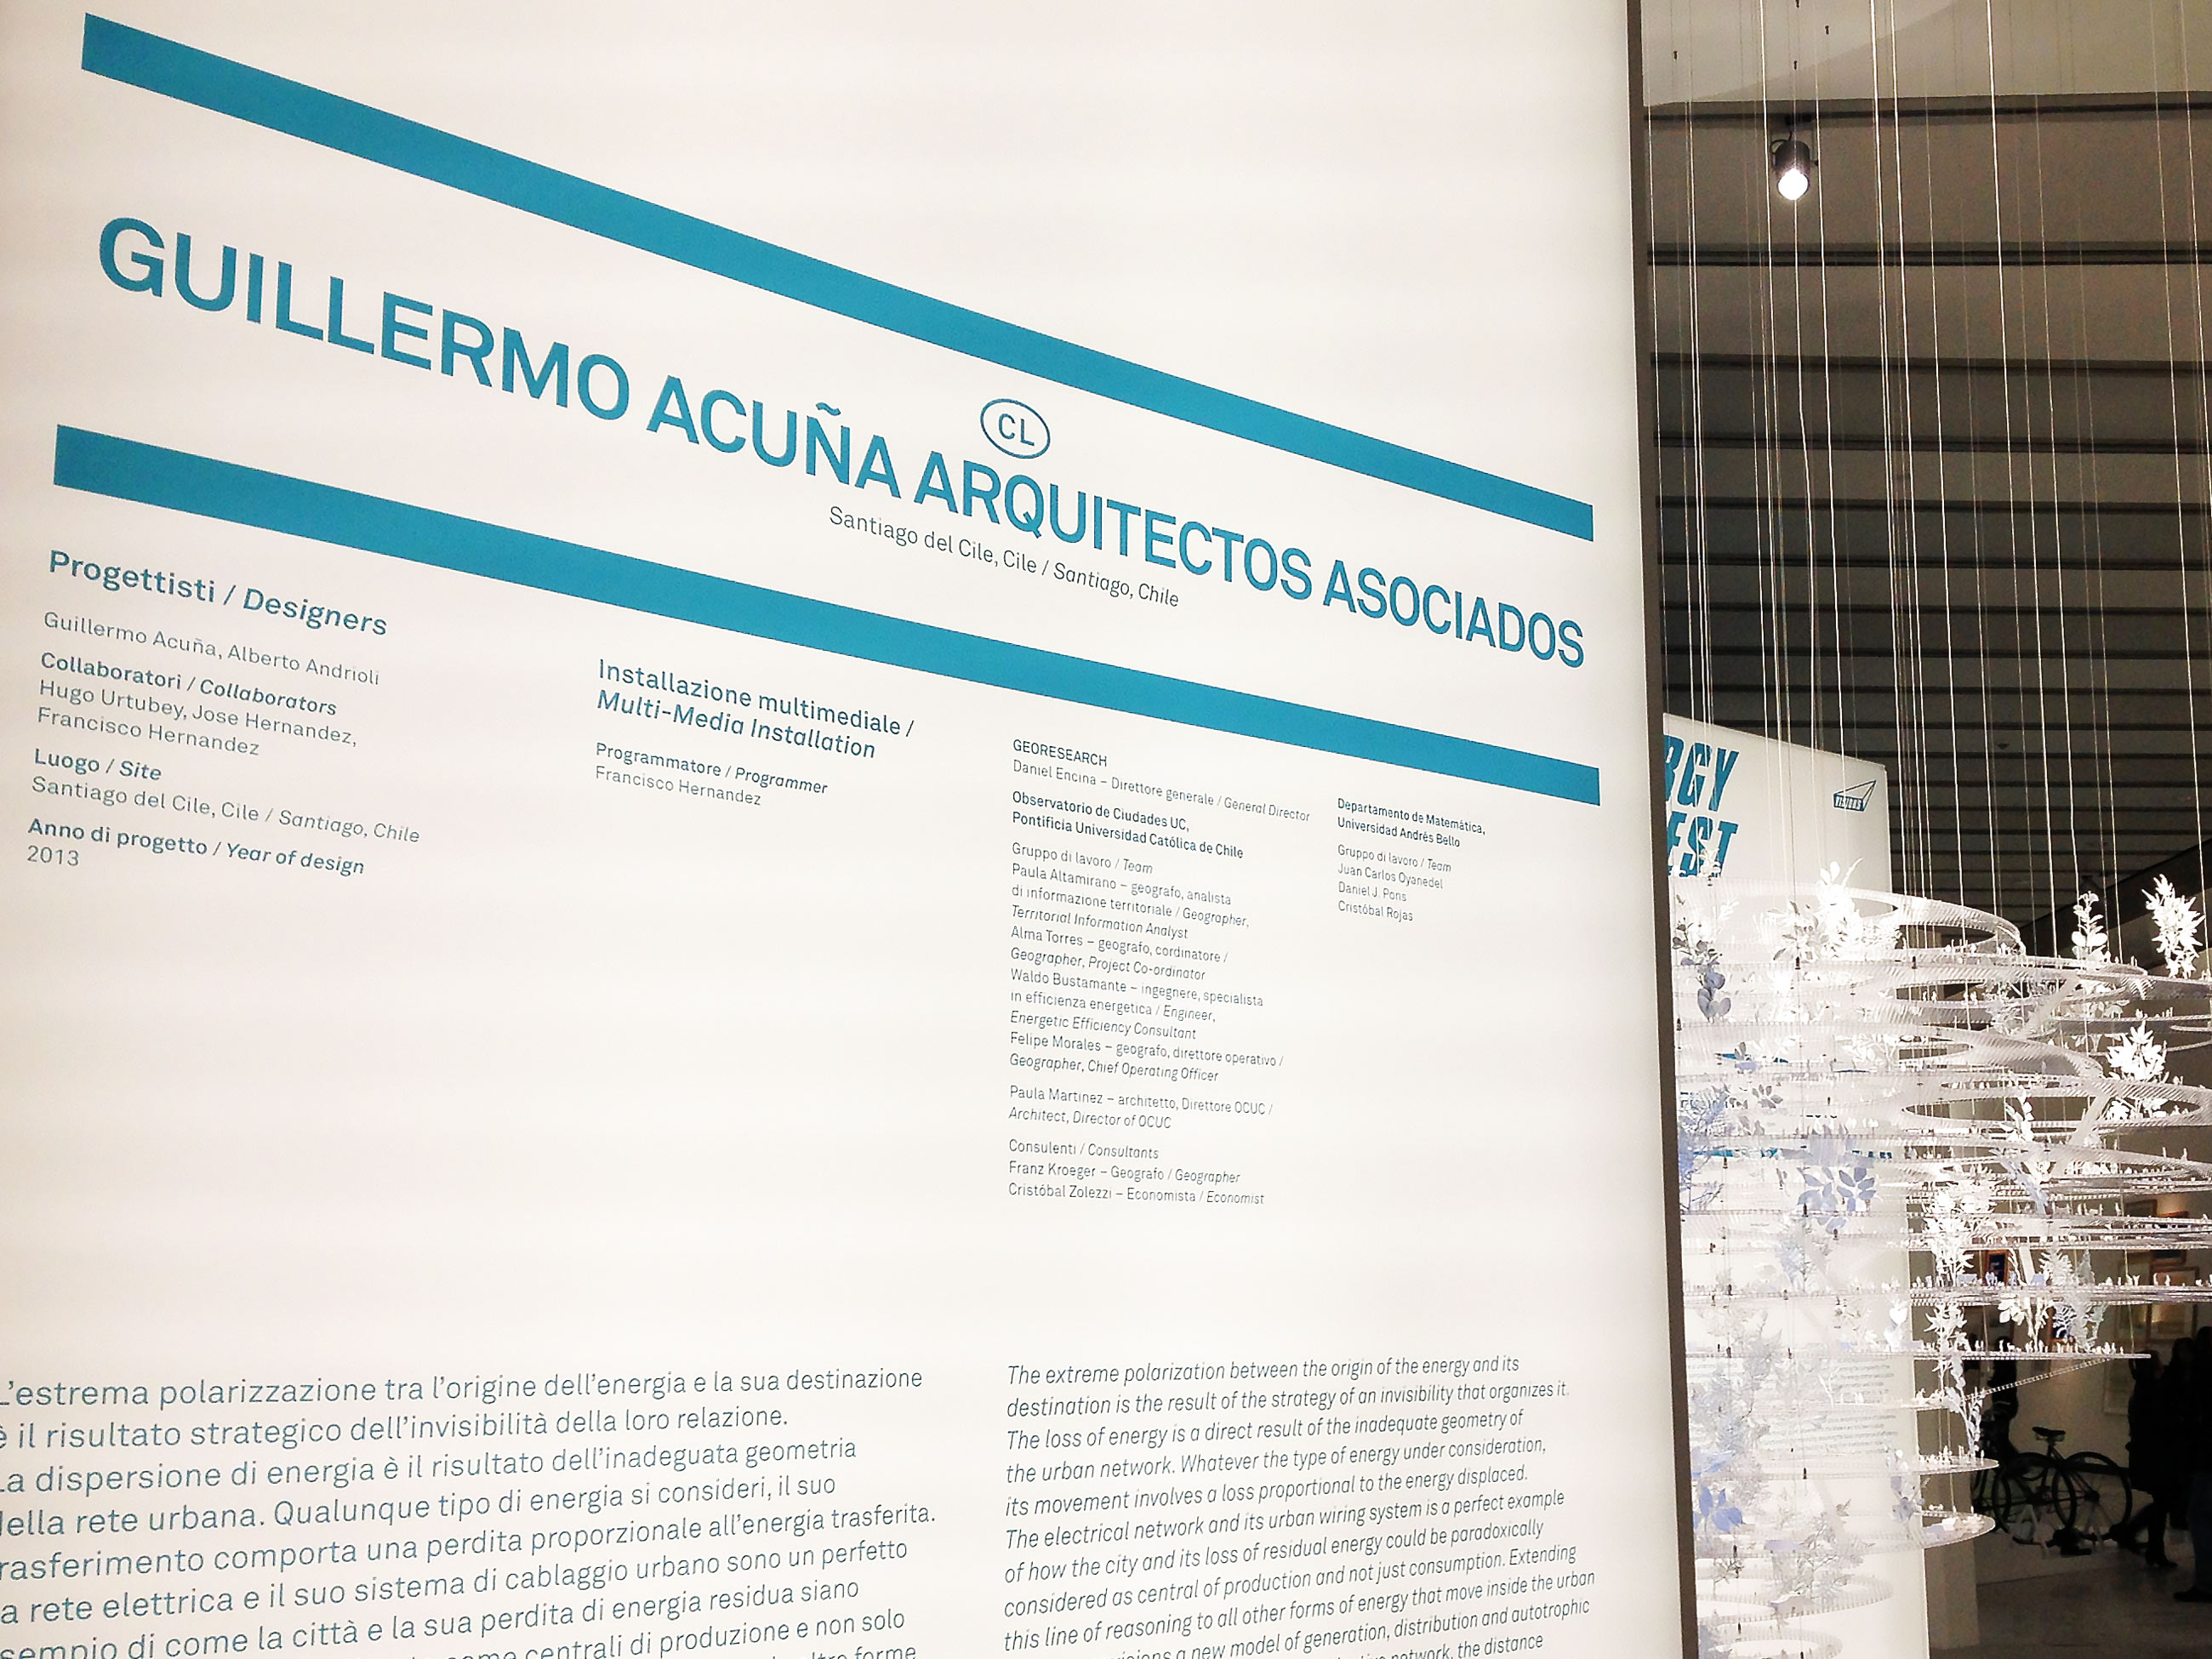
This work was presented in the MAXXI museum, Rome, as part of the ENERGY exposition. Data was generously provided by the OCUC (City Observatory - UC, Chile), GEO Research (Chile), and other was obtained directly through the Chile’s government website.
More videos of each visualization:


Links


